IREM’s 2019 Income/Expense Analysis Reports on Office Buildings

IREM’s Income/Expense Analysis Reports evaluate the performance of properties effectively by providing clean, reliable data. Reports are audited to ensure the information received is relevant to normal operating experience.
To create the 2019 Income/Expense Reports for office buildings, 2018 data was collected from 2,300 buildings – 318 in downtown locations with an average size of 318,884 square feet, and 1,442 buildings in suburban areas with an average size of 135,579 square feet.
Office Market Summary
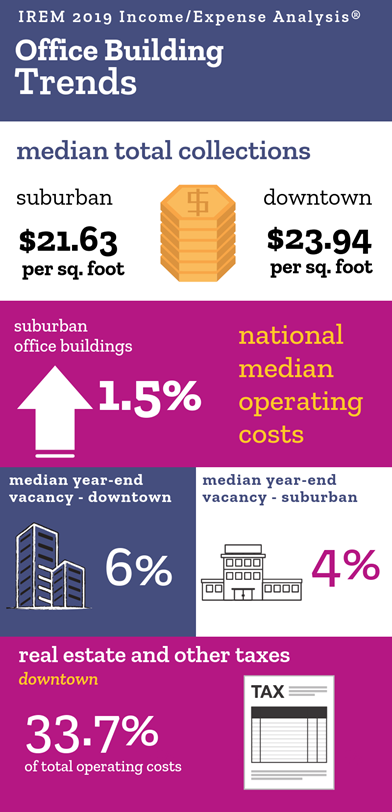
- Downtown office properties’ total collections were 10.7% higher than suburban office properties.
- Suburban office properties cost 20.5% less to operate than downtown office properties.
- Median operating ratio for a suburban office property was .42, while for a downtown office property it was .46, making suburban office properties less costly to operate than downtown office properties.
These are the highlights:
In addition to office buildings, reports are available for these property types:
- Conventional apartments
- Shopping centers
- Federally assisted apartments
- Condominiums, cooperatives & PUDS
Visit 2019 Income/Expense Analysis Reports for more information.